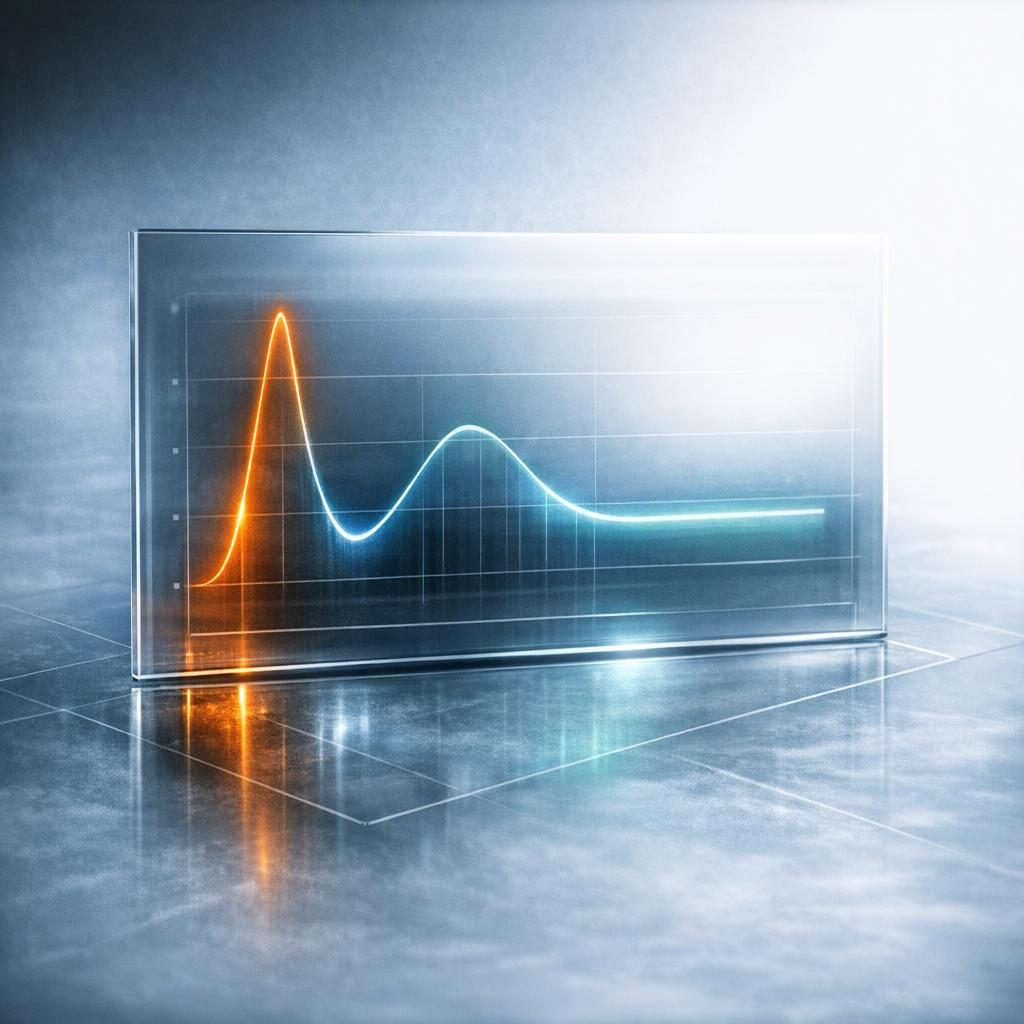
The first five minutes looked great. Then the system settled.
A new inference deployment goes live. The engineering team watches the initial metrics come in and feels good — throughput is hitting the target, latency is within bounds, the profiler shows the GPU humming along. An hour later, the numbers look different. Throughput has dropped. Clock speeds have stabilised at a lower point. The workload has moved past the transient phase where everything ran in the best possible alignment.
Nothing broke. The system moved from its peak regime into the sustained regime it will live in for the remaining 99.9% of its operational life (as an order-of-magnitude estimate).
That distinction is one of the most consequential and least examined dimensions in AI performance evaluation, and it sits at the root of why AI performance changes over time. Most performance narratives are built around best-case moments. AI systems are deployed as sustained services and long-running jobs. If you only measure the peaks, you have characterised a regime the system barely visits.
Peak performance: real, but transient
Burst metrics capture the best-case scenario under ideal thermal and power conditions. Caches are hot, clocks sit at their turbo ceiling, contention is low, and the workload is in a phase where every execution path favours speed. Those numbers are not fabricated. The system genuinely reached that level, briefly.
The problem is the inference people draw from them. A transient best-case measurement becomes “the system’s performance” in slide decks and capacity plans, even though the conditions that produced it are not sustainable. A peak figure is evidence of a capability envelope; it is not an operating promise for a 24-hour serving window or a multi-day training run.
We pay close attention to this because it is one of the most common disconnects between an evaluation result and production reality. The evaluation captures the first-few-minutes regime; production lives in the long-run regime. Both can be honest, and they can still disagree — no defects, no mistakes, just two different phases of the same machine.
Having said that, peak metrics are not meaningless. They bound what the hardware can do. They are simply the wrong input to a capacity model.
What each regime represents
| Peak regime | Sustained regime | |
|---|---|---|
| Duration | The opening seconds to minutes of a run | The hours-to-days the deployment actually runs for |
| Clocks | Boost frequency, maximum turbo | Whatever the power and thermal envelope allows to hold |
| Conditions | Fresh caches, low thermal mass, no contention | Accumulated thermal load, allocator equilibrium, persistent contention |
| What it reveals | Hardware capability envelope | Operational reality |
| Planning value | Informative for ceiling estimates | Required for capacity models and SLA commitments |
Evidence class for the rows above: observed pattern across GPU-accelerated deployments we have worked on, not a benchmarked ratio — the size of the gap is workload- and platform-specific.
Sustained load: the regime that dominates real outcomes
Long-run throughput reflects what remains after thermal equilibrium sets in and power budgets stabilize. Clocks have settled to what the power and thermal envelope will hold, the memory allocator has reached its long-run behaviour, runtime caching and compilation effects have played out, and the workload is experiencing the contention it will see persistently.
It is not a single universal number. It depends on the workload, the system configuration, and the operating objective — which is why it has to be measured rather than assumed, as we work through in steady-state performance, cost, and capacity planning. What makes it the operationally relevant figure is simply where the time goes: the regime that consumes the majority of runtime is the regime that dominates total output, total cost, and total user experience.
Reasoning about sustained load is not conservatism. It is being accurate about which regime the infrastructure budget and the SLA actually depend on.
How systems move between regimes
Gradual decline is the exception; most systems hit their limit abruptly and without warning.
GPU clocks fall as thermal mass accumulates and power management stabilises at a level it can hold — the power, thermal, and hidden governor effects that cap sustained throughput. On some systems this happens within minutes. Memory subsystem behaviour shifts as allocators settle and fragmentation appears. Runtime behaviour changes as compilation effects resolve; a torch.compile warm-up pass can make the first handful of iterations look nothing like the rest of the run. In multi-GPU setups, NCCL collective patterns behave differently after initial synchronisation than under steady traffic.
So a benchmark that captures only the opening phase — warm-up, boost clocks, fresh caches — is measuring a different system than the one that serves traffic. Both measurements are real. They describe different temporal regimes, and the longer-running one is almost always the one operational planning needs.
There is a hardware-level vocabulary for part of this. NVIDIA GPUs move between performance states, where P0 is the maximum-performance state and P8 a deep idle state. A headline figure captured inside a P0 boost window can reflect a transient clock state rather than the regime the workload runs in. A number that does not say which state it was measured in is, in practice, ambiguous.
Why does peak-oriented evaluation produce wrong decisions?
Sizing clusters around burst measurements guarantees over-provisioning for workloads that never sustain those rates. Sustained throughput then comes in lower than planned — not because something failed, but because the plan characterised the wrong regime.
This shows up concretely: latency targets met in evaluation and violated under sustained load; throughput budgets that look adequate in a short test and fall short in continuous operation; clusters sized against a marketing-grade peak that then need extra nodes to meet the real requirement.
The correction is not to discard peaks. It is to keep “what the system can do briefly” and “what the system will do persistently” as separate quantities, and to make the distinction explicit in every comparison and planning exercise.
Comparing across vendors when saturation points differ
Comparing accelerators from different vendors demands careful attention here. Two accelerators — say an NVIDIA and an AMD part — will not saturate at the same workload size. Run both at one fixed batch size and you have not compared the devices; you have compared how well each device happens to suit that batch size.
The way out is to measure each device at its own saturation point. In a LynxBenchAI run, the workload size is scaled up until throughput stops improving inside a defined noise band, while model architecture and numerical precision are held constant within a release. Only the batch size adapts. That way a comparison reflects what each device can hold when asked for as much work as it can absorb, rather than one configuration that flatters a device class.
When a sustained figure plateaus, the next question is what the plateau is made of. If throughput stops rising while the accelerator’s memory bandwidth is saturated, the number is evidence about the memory subsystem, and a faster compute unit will not move it. If arithmetic units are the binding constraint, the number is evidence about compute, and improving data layout or precision may. The plateau’s cause determines what the figure is evidence for — the same number supports very different procurement conclusions depending on which wall was hit.
Reading a sustained throughput figure: a short rubric
- Is a measurement window declared? If no duration is stated, treat the figure as a peak-regime reading until shown otherwise.
- Was warm-up excluded? A number that includes compilation and cache-fill costs is a different quantity from one that does not.
- Was the workload size raised to saturation? If the batch size was fixed across devices, the comparison is configuration-bound, not device-bound.
- Are precision and model architecture stated? Sustained throughput is only comparable within one precision and one architecture.
- Was the run repeated? A single timed window is one window, not a median across trials. Read it as such.
- Which release produced it? Figures do not travel between release names.
Performance is a curve, not a point
Recognize that performance unfolds across time rather than existing as a fixed attribute. A peak measurement gives you one point on that curve — usually near its best moment. Reasoning about sustained load asks what happens once the system has settled into the regime it operates in.
Accept that temporal dimension and a lot of mysterious results resolve. Performance did not randomly change; the system moved between regimes. The benchmark was not wrong; it measured a different phase. The production system is not underperforming; it is running under sustained load, which is what sustained load looks like.
For workloads where throughput and latency objectives pull in different directions, duration adds a further layer: the trade-off between those objectives can itself shift as the system leaves its opening phase.
Task duration belongs inside this question rather than beside it. A long-running coding or agentic workload that runs for hours is, by construction, a sustained workload — whatever clock or cache advantage existed in the first few iterations is irrelevant to total completion time. A short request that finishes inside the boost window may genuinely live near peak. The longer the task, the more a peak figure overstates what you will get.
LynxBenchAI is built around that discipline. A run discards a warm-up phase, then counts completed iterations inside one continuous timed measurement window, at a batch size already raised until throughput plateaus. It claims nothing about the machine’s thermal or clock condition inside that window — the integrity of the figure comes from the window being declared, not from the window being long. The free Personal Edition installs with pip install lynxbench-ai, and a reader can reproduce the shape of this on their own hardware in an evening rather than take our word for it.
Holding the temporal dimension as first-class across a whole running service is the applied counterpart to all of this — performance engineering for production AI is where it becomes an operational obligation rather than a reading discipline.
If a headline number and your production dashboard disagree, which one names the window it was measured in?
Frequently Asked Questions
Why does steady-state AI performance matter more than peak performance for real-world outcomes?
AI systems are deployed as sustained services and long-running jobs, so they spend the overwhelming majority of their operational life outside the transient opening phase. Total output, total cost, and total user experience are all dominated by what happens after that phase ends. Peak performance describes a window the system barely visits; sustained load describes the regime an SLA and a capacity plan actually depend on.
What does a peak GPU performance number actually tell us, and what does it leave out?
It tells you the hardware’s capability envelope under favourable conditions: hot caches, boost clocks, low contention, no accumulated thermal load. It does not tell you what the system will hold across a 24-hour serving window or a multi-day training run, because those conditions do not persist. Peak is evidence of what the hardware can reach briefly — useful as a ceiling, unusable as a commitment.
When does steady-state performance differ most from peak — and when does it not differ much at all?
The gap is widest on workloads that press thermal and power envelopes for long stretches, where clock reduction, allocator fragmentation, and collective-communication patterns have time to compound. It is narrowest on short bursty workloads that finish inside the boost window, and on systems not power- or thermally constrained at their nominal operating point. The amount of divergence is workload- and platform-specific, not a fixed ratio, and sustained is not universally lower than peak.
How should a benchmark reader interpret a headline number that does not state how long the workload ran?
Treat it as a peak-regime reading until shown otherwise, and do not use it to size capacity or commit to an SLA. The temporal scope is part of the claim, so a figure without it is incomplete rather than merely imprecise. What makes a sustained figure trustworthy is that the window is declared — not that it is long.
How should the duration of a task — for example a long-running coding or agentic workload — change the way we read an AI performance number?
A workload that runs for hours is a sustained workload by construction: any clock or cache advantage in the first few iterations contributes almost nothing to total completion time. A short request that finishes inside the boost window may genuinely live near peak. So the longer the task, the more a peak figure overstates the result you will actually get — duration is part of how the number should be read, not a separate concern.
How should a reader compare sustained AI throughput across vendors (for example NVIDIA vs AMD accelerators) when each device may saturate at a different workload size?
Compare each device at its own saturation point rather than at one shared batch size, because a fixed workload size measures fit-to-configuration as much as it measures the device. A LynxBenchAI run raises the workload size until throughput stops improving inside a defined noise band, holding model architecture and numerical precision constant within a release so only the batch size adapts. Figures should also be read within one release name; they do not travel between releases.
When a sustained figure plateaus, how do you tell whether the limit is compute or memory bandwidth — and why does that distinction change what the number is evidence for?
Look at what is saturated when throughput stops rising: if the memory subsystem is the binding constraint, the number is evidence about bandwidth and a faster compute unit will not move it; if arithmetic units bind, it is evidence about compute and data layout or precision changes may. The same throughput figure therefore supports different procurement conclusions depending on which wall was reached. That is why a plateau is only informative alongside the conditions that produced it.
Burst versus sustained: which matters for your workload
Thirty seconds of throttle-free operation reveals nothing about multi-hour training runs on frontier models. Is that executor close enough to yours for the result to mean anything?