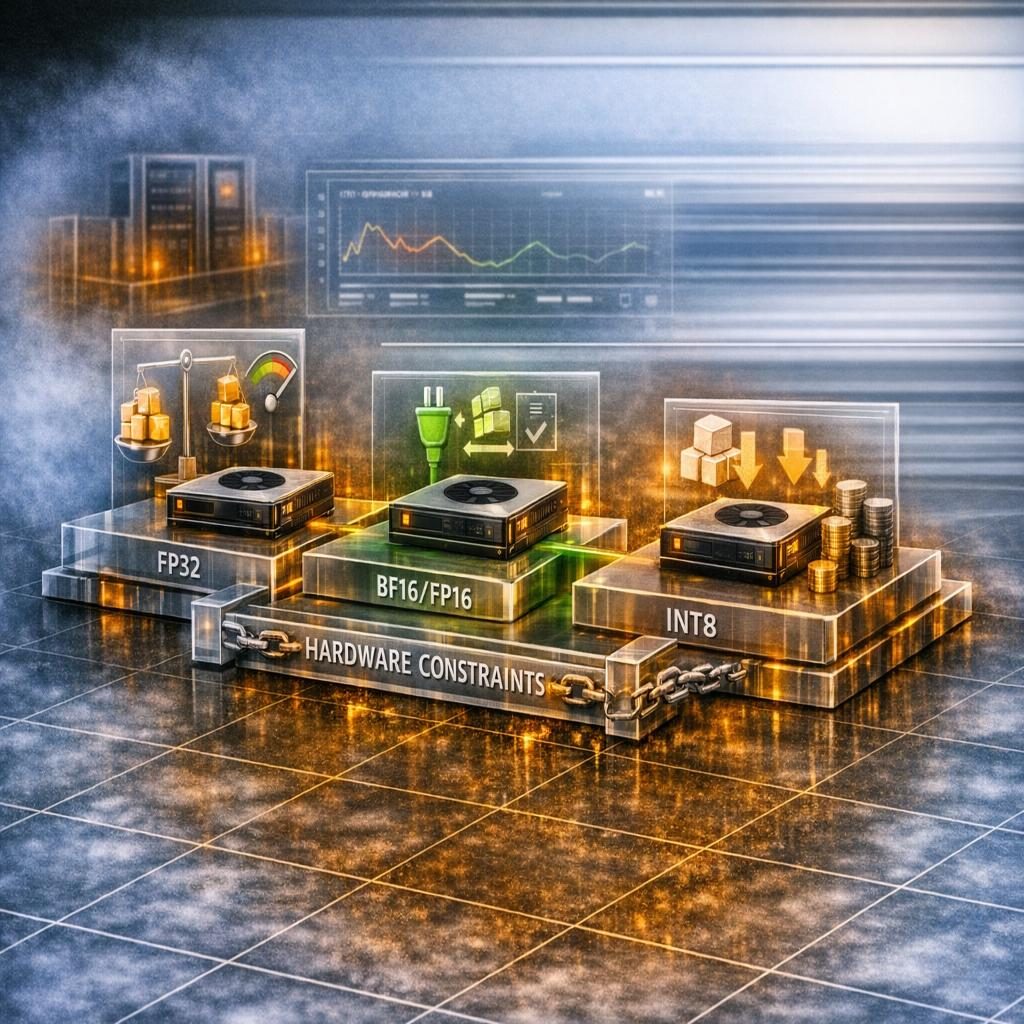
A vision pipeline that drops frames is the workload teams most often assume needs a rewrite. The assessment that decides whether it does starts by refusing to treat the pipeline as one thing.
Frames arrive faster than the Python serving path can retire them. The reflex is predictable: rewrite the pre- and post-processing in C++, or push everything onto the GPU and be done with it. That reflex sometimes turns out to be correct. What makes it expensive is committing to it before anyone has measured which of the pipeline’s five or six stages actually owns the wall clock. A computer vision inference pipeline decomposes cleanly — decode, resize and normalise, model forward pass, non-maximum suppression or mask post-processing, serialisation of results — and in our experience the dominant stage is frequently not the one the team named in the kickoff call.
This article walks one such assessment end to end, so the method is visible against numbers rather than described in the abstract.
What does a porting assessment applied to a CV inference workload look like in practice?
Begin with profiling to allocate a time budget, then treat optimization as a purchasing decision against fixed resources.
The unit of analysis is the stage, not the service. You instrument the pipeline so every frame’s time is attributed to exactly one stage, run it on representative inputs (real resolutions, real batch sizes, real concurrency — not a synthetic loop over one cached image), and read the resulting share table. Only then do you ask which candidate target runtime touches the stages that matter, and what moving them would cost in engineering days.
The order is not cosmetic. A port priced before the profile is a guess with a Gantt chart attached. Attribution first constrains everything downstream: the share of runtime a stage owns is the hard ceiling on what porting that stage can return, no matter how fast the target runtime is in isolation.
The baseline the assessment captures
For a CV pipeline the baseline is a small, fixed set of measurements, and all of them are needed before a target is named:
- Per-stage latency breakdown — mean and p95 for each stage, as absolute milliseconds and as a share of the frame budget.
- Throughput and tail latency — frames per second and p95 end-to-end latency at the batch size currently in production, not the batch size that benchmarks best.
- Accelerator occupancy — whether the forward pass is actually saturating the device or waiting on it.
- Host-to-device transfer time and copy count — per-frame copies are the stage teams most reliably forget to instrument.
- Serialisation cost — encoding detections, masks, or crops back out of the process.
The transfer and copy line matters more in vision than in most workloads, because frames are large and the temptation to move them across the PCIe boundary more than once per inference is high. Our sibling article on profiling a Python inference path before committing to a port covers the instrumentation mechanics in more depth; here we take the profile as given and reason from it.
The worked profile
Here, the workload consists of one detection model distributed across a camera network. What the instrumented run returned, in rough shares of the frame budget:
| Stage | Share of frame time | Runs on | Port candidate touches it? |
|---|---|---|---|
| Decode | moderate | Host CPU | Yes — hardware decode or C++ path |
| Resize + normalise | large | Host CPU, per-frame Python | Yes — CUDA or C++ |
| Host→device transfer | moderate | PCIe, multiple copies per frame | Yes — copy elimination, pinned memory |
| Model forward pass | large | GPU, high occupancy | No — already accelerator-bound |
| NMS / mask post-processing | small–moderate | Host CPU | Yes — CUDA kernel |
| Result serialisation | small | Host CPU | Marginal |
Two things fall out of that table immediately. First, the forward pass is a large share of the budget and the device is already busy during it — that portion of the frame time is not addressable by rewriting the surrounding glue in another language. Second, the combination of host-side resize/normalise plus redundant per-frame copies is comparable in size to the forward pass, and it is entirely addressable.
That is the divergence point the assessment exists to find. Had the profile come back with the forward pass owning the overwhelming majority of frame time at high occupancy, the honest recommendation would have been deferral: a C++ rewrite of the glue would have bought single-digit percentages, and single-digit percentages do not justify a quarter of engineering time and a permanently larger maintenance surface. The measured shares said otherwise for this pipeline.
Ranking the target runtimes against the measured profile
Order candidates by the fraction of execution time they control, disregarding vendor performance narratives.
| Target | Reaches which stages | Fit against this profile | Cost class |
|---|---|---|---|
| CUDA kernels for resize/normalise + NMS | The large host-side pre-processing share and the post-processing tail | Strong — moves work to a device with measured headroom during those windows | Moderate; needs CUDA-competent maintainers |
| C++ rewrite of the host path (with OpenCV) | Decode, resize, serialisation | Moderate — real gain, smaller than the CUDA path, easier to staff | Moderate |
| Copy elimination + pinned memory (no language change) | Host→device transfer | Strong per engineering day; often the cheapest measurable win | Low |
| CPU vectorisation (SIMD, tuned build flags) | Host-side numeric stages | Weak here — the accelerator is the better home for this work | Low |
| WASM / WebGL | Whole pipeline, browser deployment | Not applicable — this pipeline serves a camera fleet, not a browser | N/A |
The last row is worth dwelling on. WebAssembly and WebGL are legitimate porting targets and appear frequently in assessments, but only when a deployment surface demands them. Ranking them here would be ranking a constraint nobody has. The generic version of this ranking logic — how the target language falls out of the profile rather than out of preference — belongs to the port-to-C++/WASM decision framework on the GPU side; this article is the instantiation of it against one vision workload.
Pricing the port against the estimated gain
For every target: runtime share accessible, projected speedup interval, and days-of-work derived from codebase topology—invocation density, test infrastructure, numeric regression protocols.
For this pipeline the shape of the answer was: copy elimination first, as a low-cost change with a measurable throughput return and no new language in the repository; CUDA kernels for resize/normalise and NMS second, as a scoped multi-week piece with a stated target FPS; a full C++ rewrite of the serving path declined, because most of what it would have touched was already covered by the two cheaper items. The payback window was computed against current inference spend on the fleet, which is what let the recommendation survive a conversation with a budget owner rather than only with engineers.
A note on the numbers, because it decides how this example should be read: the speedup ranges quoted in that assessment were the ones this pipeline’s profile supported. They are not a factor that transfers to another workload. What transfers is the method — decompose, attribute, rank by addressable share, price against the measured ceiling, then commit or defer. A team that copies the conclusion instead of the method has skipped the only step that made the conclusion defensible. The structural argument for why that skip is so common is developed in why porting often moves cost without moving the bottleneck.
Where the boundary sits
Under two circumstances, reassessment becomes mandatory. If the model itself were changed — a smaller backbone, a quantised variant, a different resolution — the stage shares would move and the ranking would need re-running, because a cheaper forward pass makes the host-side stages a larger fraction of a smaller budget. And if the pipeline served multiple models with different pre-processing, the per-frame copy analysis would need doing per model path; averaged across paths it hides exactly the asymmetry that makes one path worth porting.
Vision pipelines vary more than their diagrams suggest. Decode strategy, whether masks or boxes come out the far end, and how many times a frame crosses the host-device boundary are enough to reorder the target ranking on two pipelines that look identical on a whiteboard. That is the argument for profiling each one rather than reusing a prior verdict — and the reason the deliverable is a decision document with a stated evidence basis, not a speedup promise. We discuss the vision-side engineering context this sits inside on our computer vision page.
If a porting assessment on your pipeline came back recommending deferral, would the roadmap actually absorb that answer — or has the rewrite already been staffed?
Frequently Asked Questions
What does a porting assessment applied to a CV inference workload mean in practice? Porting Assessment Applied CV is one of those terms that hides a simple idea. With Porting Assessment Applied CV, the detail that matters is this. It means instrumenting the pipeline so every millisecond of frame time is attributed to a single stage, running it on representative inputs, then ranking candidate target runtimes by the share of runtime each one can actually reach. The output is a defer-or-commit recommendation with a cost model attached, not a language preference.
How is a vision pipeline decomposed into stages for profiling, and which stages usually dominate? The natural decomposition is decode, resize and normalise, model forward pass, NMS or mask post-processing, and result serialisation, with host-to-device transfer measured separately. The dominant stage is frequently not the one the team expected — host-side pre-processing and redundant per-frame copies compete with the forward pass more often than teams assume.
What baseline metrics does the assessment capture? Per-stage mean and p95 latency, frames per second and p95 end-to-end latency at the production batch size, accelerator occupancy during the forward pass, host-to-device transfer time and copy count per frame, and serialisation cost. Occupancy and copy count are the two that most often flip a recommendation.
Which target runtimes are evaluated for a CV pipeline, and how are they ranked? CUDA kernels, a C++ host path, copy elimination without a language change, CPU vectorisation, and WASM/WebGL are the usual candidates. They are ranked by addressable share of measured runtime and by deployment fit — WASM and WebGL only rank when a browser surface is a real requirement, not because they are fast in isolation.
What does the defer recommendation look like when the forward pass already saturates the accelerator? It states the measured occupancy and the forward pass’s share of frame time, shows that the remaining stages cap any port’s return at single-digit percentages, and recommends spending the quarter elsewhere. A documented deferral is a successful assessment outcome, not a failed one.
How do the numbers from this example transfer to a different vision workload? The stage decomposition and the ranking method transfer. The speedup figures do not — they were what this pipeline’s profile supported, and a different backbone, resolution, or output format reorders the shares enough to change which target wins.
Turning insight into execution
CV inference demands meeting latency SLAs in deployment conditions, holding accuracy drift within spec, and proving throughput on actual silicon.