Introduction
The right GPU choice can shorten training cycles, reduce inference bills, and keep projects on schedule. Yet selecting a device based on a single chart is risky. Benchmarks must reflect how you actually work: your AI workloads, models, data flows, and service‑level goals.
This article sets out a clear approach to gpu benchmarking, with an emphasis on the real world rather than lab trivia. We cover training and inference, Large Language Model (LLM) cases, interconnect and memory effects, power and cost normalisation, and the coming impact of the Blackwell architecture. By the end, you will have a concrete way to judge GPU benchmarks for AI and to defend your choices.
Why benchmark at all?
AI systems are complex. The same card can look fast on a micro‑test yet underperform in production due to data stalls, small batches, or chatty collectives. Benchmarks give you:
-
A shared baseline for comparing devices and clusters.
-
Evidence to size capacity and budgets.
-
Early warnings about bottlenecks that could block a launch.
The aim is not to chase the highest number. It is to measure the right numbers that map to how your AI workloads behave day to day.
Read more: GPU vs TPU vs CPU: Performance and Efficiency Explained
Read more: Why GPU Performance Is Not a Single Number
First principles: what “good” looks like
A useful benchmark suite does three things:
-
Represents your workload mix. Include the model types and shapes you run most often: image models, speech models, retrieval, recommendation, and at least one large language model use case.
-
Captures the full path. Measure the model and the data path around it; preprocessing, tokenisation, data loaders, and post‑processing.
-
Produces decision‑ready metrics. Track throughput (items/sec), latency percentiles, time‑to‑accuracy for training, energy per item, and cost per item. Tie each number to a target so results dictate action.
Training vs inference: two very different stories
Training stresses long runs, high utilisation, and network collectives. Your key questions are: “How much wall time per epoch?” and “How stable is utilisation over hours or days?” For model training, watch these components:
-
Compute kernels. Convolutions, attention, and matrix multiplications dominate.
-
Memory bandwidth and capacity. Spills or swaps can ruin throughput.
-
Collectives (all‑reduce, all‑gather). Poor scaling makes big nodes feel small.
-
I/O. Dataloaders and storage can starve the device even when kernels are efficient.
Inference is about latency and cost at a given quality. Here the main loops are prompt/token handling for a large language model, batching strategy, and the trade‑off between throughput and tail latency. Small batch, low‑latency services behave very differently from high‑throughput batch jobs. Benchmark both modes if you run both.
Read more: Training and Inference Are Fundamentally Different Workloads
Read more: GPU Computing for Faster Drug Discovery
“Real‑world” setup: keep it honest
Your benchmark should be boring in the best sense; predictable, reproducible, and close to production:
-
Use the same containers, drivers, and runtime flags that you use in production.
-
Fix seeds and versions, and write down every setting.
-
Warm the system before taking measurements so you do not record first‑run jitters.
-
Pin data sources to the same storage class and network path used in your environment.
-
Record power draw at the wall if possible, not just device‑reported numbers.
When you publish results internally, include all artefacts: scripts, commit hashes, container digests, and a short description of the machine room or cloud region.
Read more: The Role of GPU in Healthcare Applications
Metrics that make decisions easier
A long list of counters can hide the truth. Focus on metrics tied to outcomes:
-
Throughput: items/sec or tokens/sec at fixed quality.
-
Latency: median and P95/P99 per request, plus cold‑start and spike behaviour.
-
Time to target accuracy: number of hours to reach a given validation score for training.
-
Energy per item: joules per token or image at target settings.
-
Cost per item: normalise by actual cloud/on‑prem rates, including interconnect charges.
-
Stability: variance over long runs, error rates, and retry counts.
If a number will not change a decision, do not prioritise it.
Read more: GPU‑Accelerated Computing for Modern Data Science
The data you feed matters as much as the device
It is easy to overfit a benchmark to a toy dataset. Avoid that trap:
-
Match sequence lengths to your real traffic, not a convenient fixed length.
-
Preserve class imbalance and input shape variety if your production traffic has it.
-
Include preprocessing (tokenisation, resizing, normalisation) in the timed path if it runs at inference time in production.
-
Test your top three workloads rather than one proxy. That gives a truer picture than a single “hero” model.
LLM‑specific benchmarks
LLM testing needs care because it mixes compute and memory pressure:
-
Prompt mix. Use a realistic mix of short prompts, long prompts, and multi‑turn contexts.
-
Batch strategy. Compare static batching, dynamic batching, and continuous batching; each shifts the throughput/latency balance.
-
KV‑cache policy. Decide how you count cache memory and evictions; it has a major effect on capacity and token rate.
-
Speculative decoding or assisted decoding can change both speed and quality—measure both the gain and any accuracy impact.
Introduce Large Language Model (LLM) once, then keep the term “model” for readability.
Read more: CUDA vs OpenCL: Picking the Right GPU Path
The role of interconnects and topology
Single‑GPU performance is only the start. Many AI workloads rely on many devices acting as one:
-
Within a node, links (NVLink‑class or PCIe) govern how fast you can share tensors.
-
Across nodes, your fabric (InfiniBand/Ethernet and its settings) decides whether model or data parallelism scales.
-
Topology awareness matters: ring vs tree collectives, placement of ranks, and affinity settings can shift results by large margins.
Your gpu benchmarking must include at least one multi‑GPU and one multi‑node run that mirrors the path you plan to operate.
Memory capacity, bandwidth, and why they trump FLOPs on bad days
Datasets and models are growing faster than FLOPs. Capacity and bandwidth often decide whether work is fast or slow:
-
Capacity limits batch size, context length, and model size without offloading.
-
Bandwidth feeds the cores; if it cannot keep up, FLOPs go unused.
-
Cache behaviour can either sustain high utilisation or cause a stop‑go pattern that ruins latency.
A fair report notes when bandwidth or capacity is the limiter, not just “GPU X is slower than GPU Y”.
Read more: Choosing TPUs or GPUs for Modern AI Workloads
Blackwell architecture: what to plan for
As new GPUs arrive, your benchmark suite should flex, not break. For the Blackwell architecture, plan for:
-
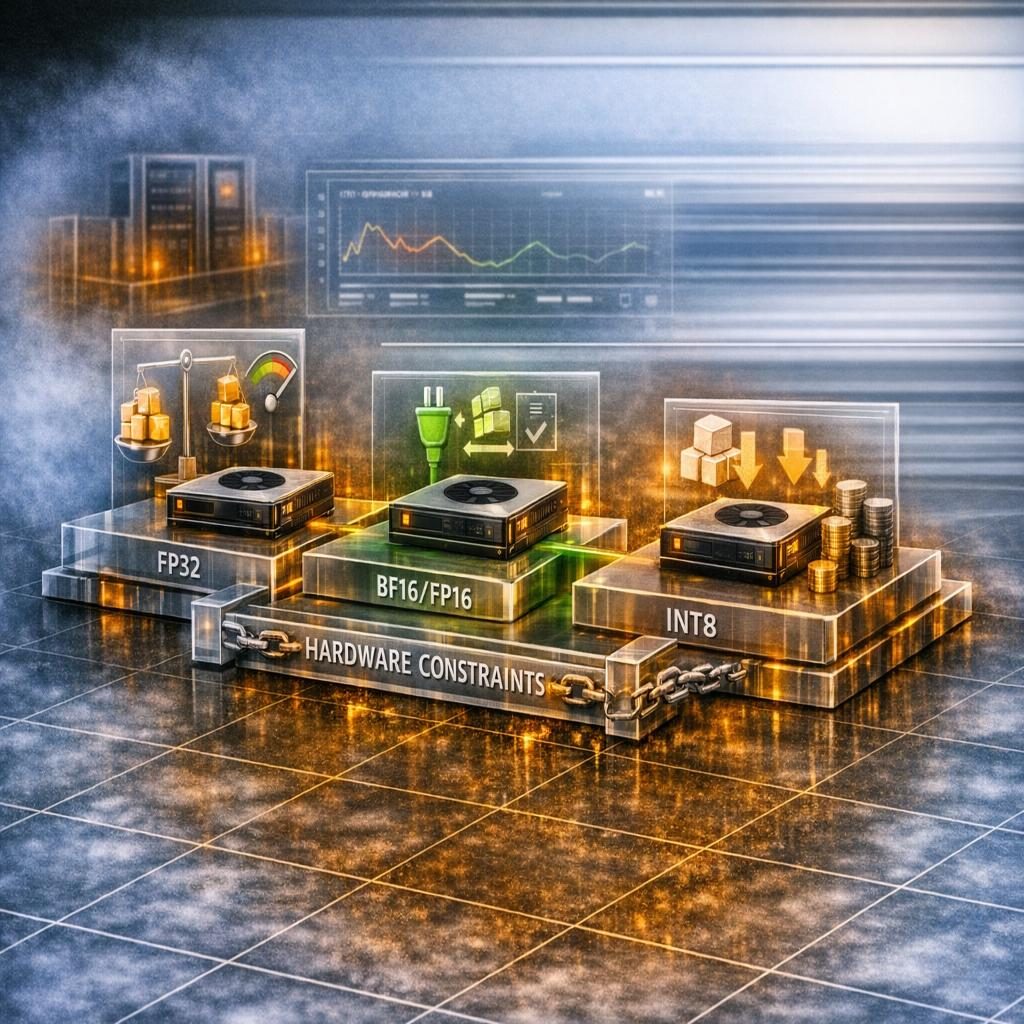
New tensor data types and lower‑precision paths that can change both speed and accuracy trade‑offs.
-
Larger memory pools or faster memory that shift the sweet spot for batch size and context length.
-
Interconnect upgrades that improve scaling behaviour in multi‑GPU jobs.
-
Scheduler and compiler changes that affect kernel fusion and launch overheads.
Do not copy numbers between generations without repeating your runs. Even small runtime changes can invalidate old conclusions.
Synthetic vs application benchmarks
You need both:
-
Synthetic tests (e.g., GEMM rates, memory bandwidth micro‑benches) show peak device behaviour and identify hardware ceilings.
-
Application tests (full model training and inference) show end‑to‑end reality with data movement, batching, and service orchestration included.
Use synthetic results to explain why a device behaves a certain way. Use application results to justify what to buy or deploy.
Read more: Energy-Efficient GPU for Machine Learning
Avoiding common pitfalls
-
Testing one batch size. Real services see a mix; tune and test across the range.
-
Ignoring the data path. A perfect kernel cannot help if storage throttles you.
-
Comparing different accuracy. Fix the quality target first, then compare speed and cost.
-
Cherry‑picking models. Include at least one case that is memory‑bound and one that is compute‑bound.
-
Short runs only. Long‑run drift and thermal or throttling effects appear after hours, not minutes.
Reporting results the business can use
Present numbers in the language of outcomes:
-
Training: “Model A reaches target accuracy in 9.5 hours on System 1 vs 12.3 hours on System 2 (–23% time). Energy per epoch –18%. Cost per epoch –21%.”
-
Inference: “At P95 ≤ 60 ms, System 1 serves 1.7× more tokens/sec. Cost per 1M tokens –28%.”
-
Capacity: “Max context 64k with acceptable latency on System 1; System 2 requires KV offload above 48k.”
Attach the “how”: environment, container, versions, flags, and test scripts. That lets others repeat and trust the results.
Read more: AI Computer Vision in Biomedical Applications
Building your own suite
A simple, durable suite can start small and grow:
-
Pick three workloads. For example: one vision model, one speech or recommendation model, and one LLM.
-
Define targets. Accuracy target for training, latency caps for inference, and a fixed budget of energy.
-
Automate. One script to provision, run, and collect metrics.
-
Store artefacts. Keep raw logs, plots, and config files.
-
Schedule repeats. Rerun when drivers or kernels change, or when you add a new GPU family.
Over time, add corner cases (very small batches, very long contexts), stress tests, and failure drills (node loss, throttling, noisy neighbours).
From numbers to strategy
Once you trust your benchmark, connect it to planning:
-
Procurement. Choose devices by cost per trained epoch or cost per 1M tokens at your latency target.
-
Capacity planning. Translate throughput into nodes required for the next quarter.
-
SLA design. Tie latency and tail‑latency to model settings and batching rules.
-
Energy and sustainability. Use energy per item and energy per epoch to track and improve your footprint.
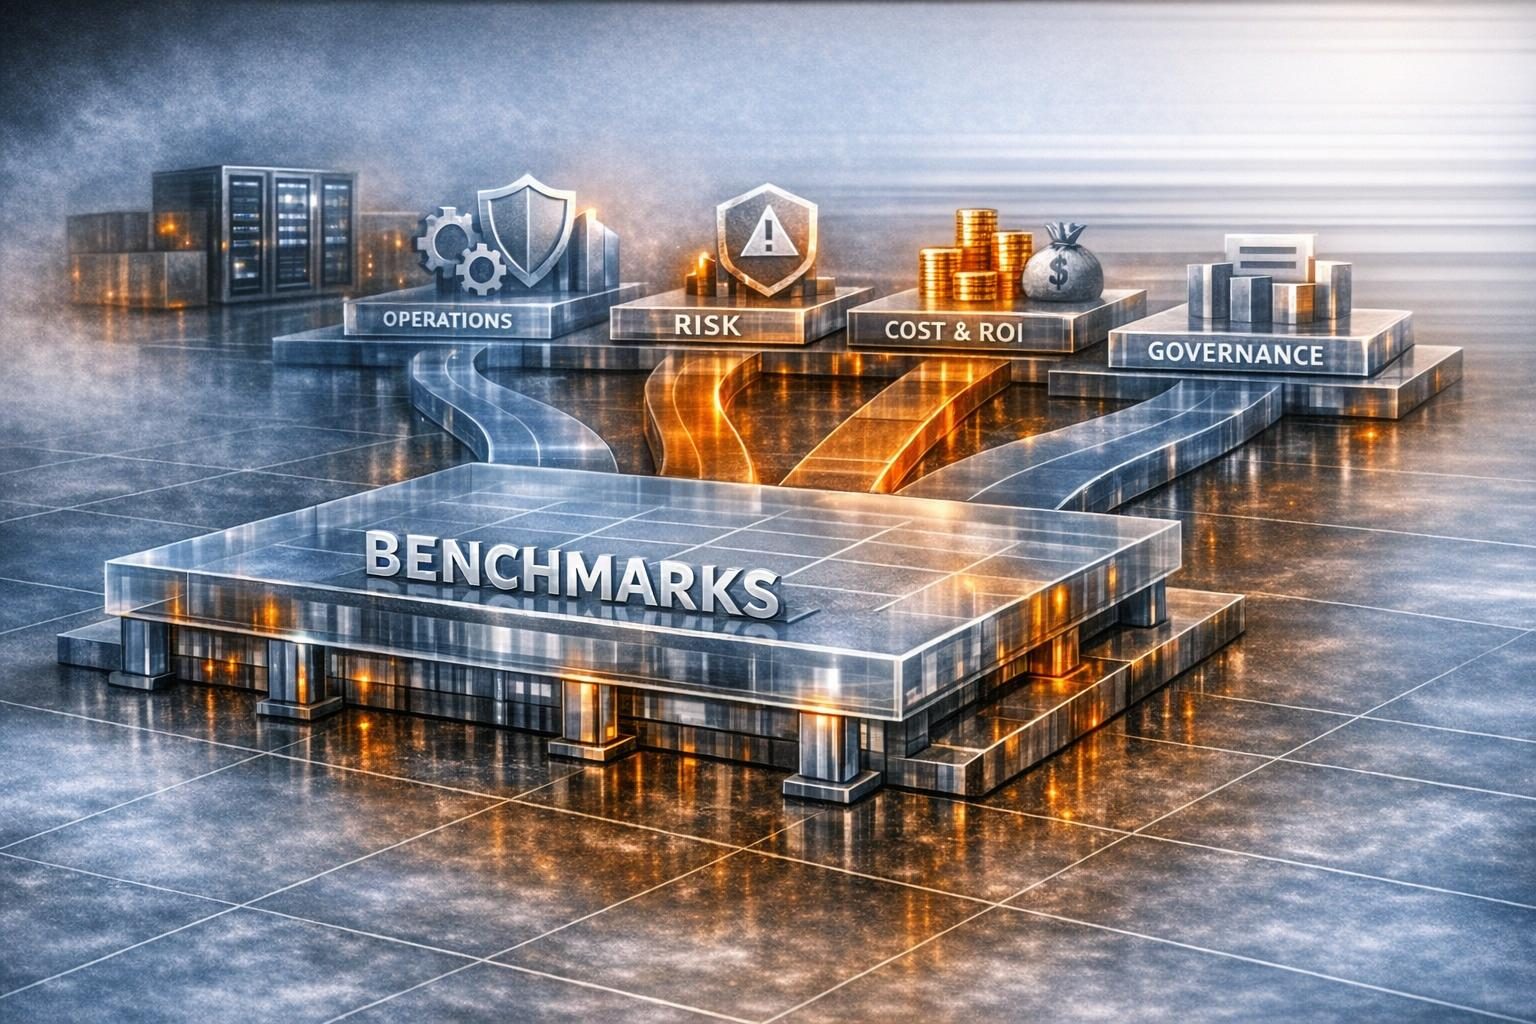
This is where real world results matter most: they turn charts into budgets, timelines, and promises your team can keep.
Read more: Modern Biotech Labs: Automation, AI and Data
Case‑style model mixes to include
While every company is different, the following mixes tend to reveal the right things:
-
Token‑heavy LLM generation. Vary prompt length, context window, and assisted decoding on/off.
-
Encoder‑heavy workloads. Speech or vision encoders that stress memory and batching without long decoding loops.
-
Retrieval‑augmented patterns. Model plus vector search, to see the effect of I/O and concurrent computing tasks.
-
Small interactive services. Low batch, strict latency, and bursty traffic—harder than it looks, and common in production.
Each mix highlights different device traits and exposes scaling or data‑path issues that a single model would hide.
Interpreting “GPU benchmarks for AI” headlines
Public charts can be helpful, but treat them as a starting point:
-
Ask what was fixed. Accuracy, latency caps, and batch rules change outcomes.
-
Check the data path. Did the test include preprocessing and post‑processing?
-
Look for variance. Median is not enough; P95 and P99 decide user experience.
-
Mind the generation gap. New kernels and compilers can move results by double digits.
If a headline number contradicts your real world test, trust your test. Your traffic shape and constraints are unique.
Read more: Enhance Your Applications with Promising GPU APIs
What to expect as hardware advances
As new generations land, expect:
-
Higher memory capacity and quicker memory to raise the ceiling on long contexts and large batches.
-
Smarter compilation and kernel fusion to reduce launch overheads.
-
Better interconnects that make multi‑GPU systems behave more like one big device.
-
New precisions that change the balance between speed and accuracy.
With the Blackwell architecture, prepare to rerun your suite with updated kernels and datatypes, and re‑tune batch rules and cache policy. Carry over methods, not numbers.
TechnoLynx: Benchmarking and performance engineering you can use
TechnoLynx designs, automates, and runs GPU benchmarking that mirrors your production AI workloads. We build suites that test training and inference, from compact image models to your largest large language model, then turn results into practical changes: topology and batch rules, data‑path fixes, kernel choices, and fair cost and energy comparisons across hardware families; current devices and the upcoming Blackwell architecture included. We also help teams fold the suite into CI so every driver or kernel change gets a quick pass before it hits production.
If you want benchmark results that hold up in the real world and upgrades that move the needle, contact TechnoLynx today! We will shape a method around your models, your constraints, and your goals and deliver a clear plan you can act on immediately.
Image credits: Freepik


