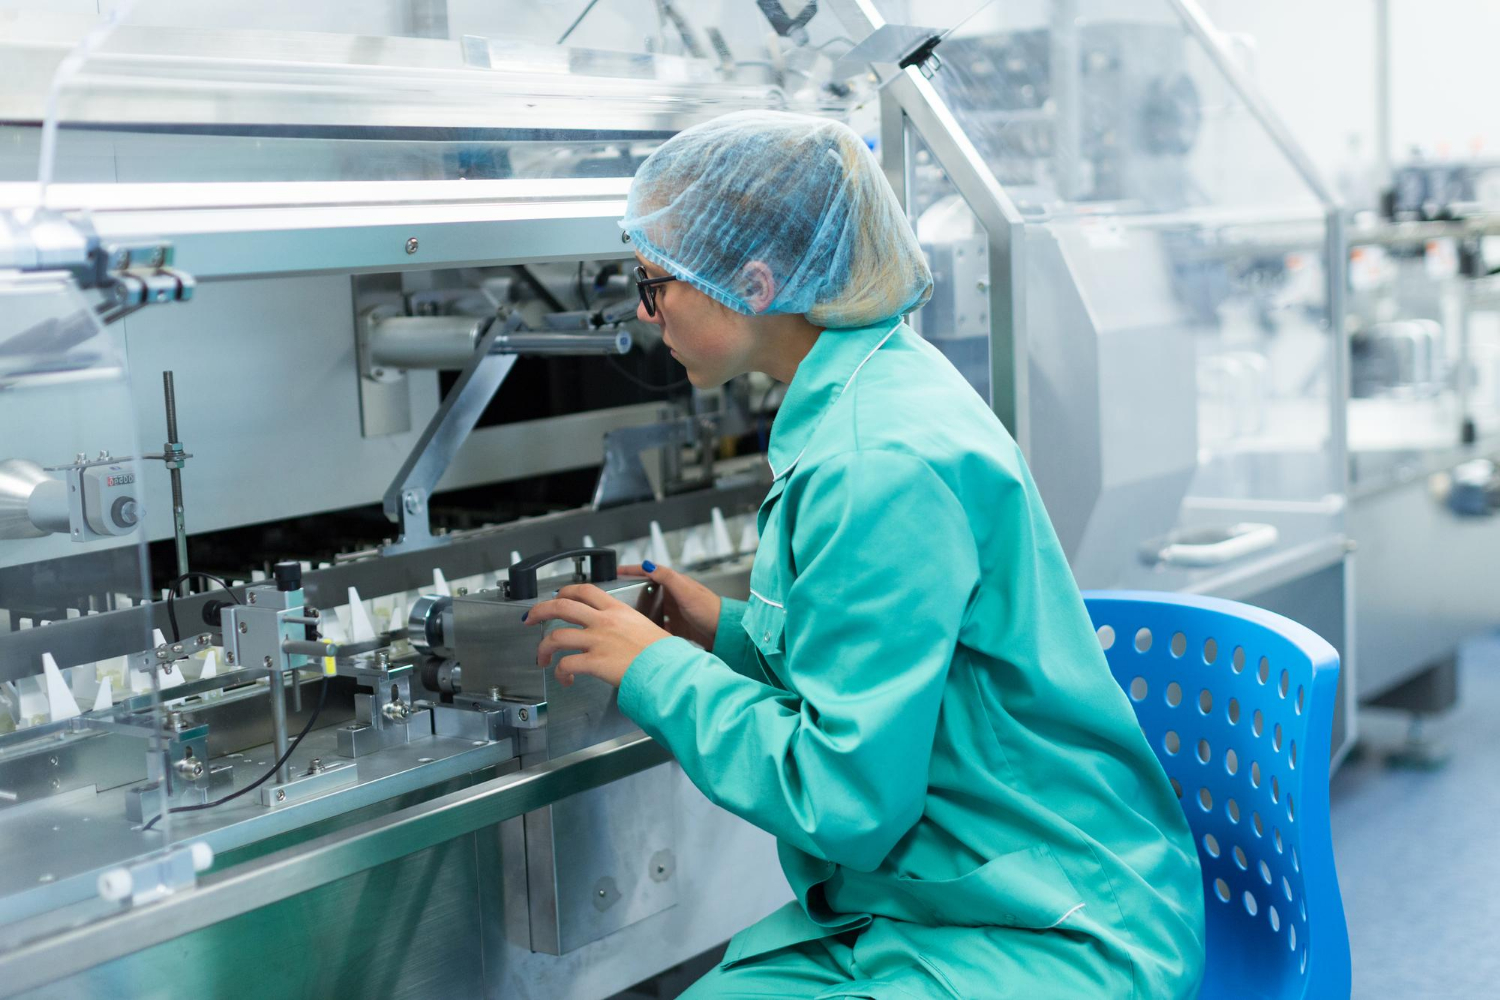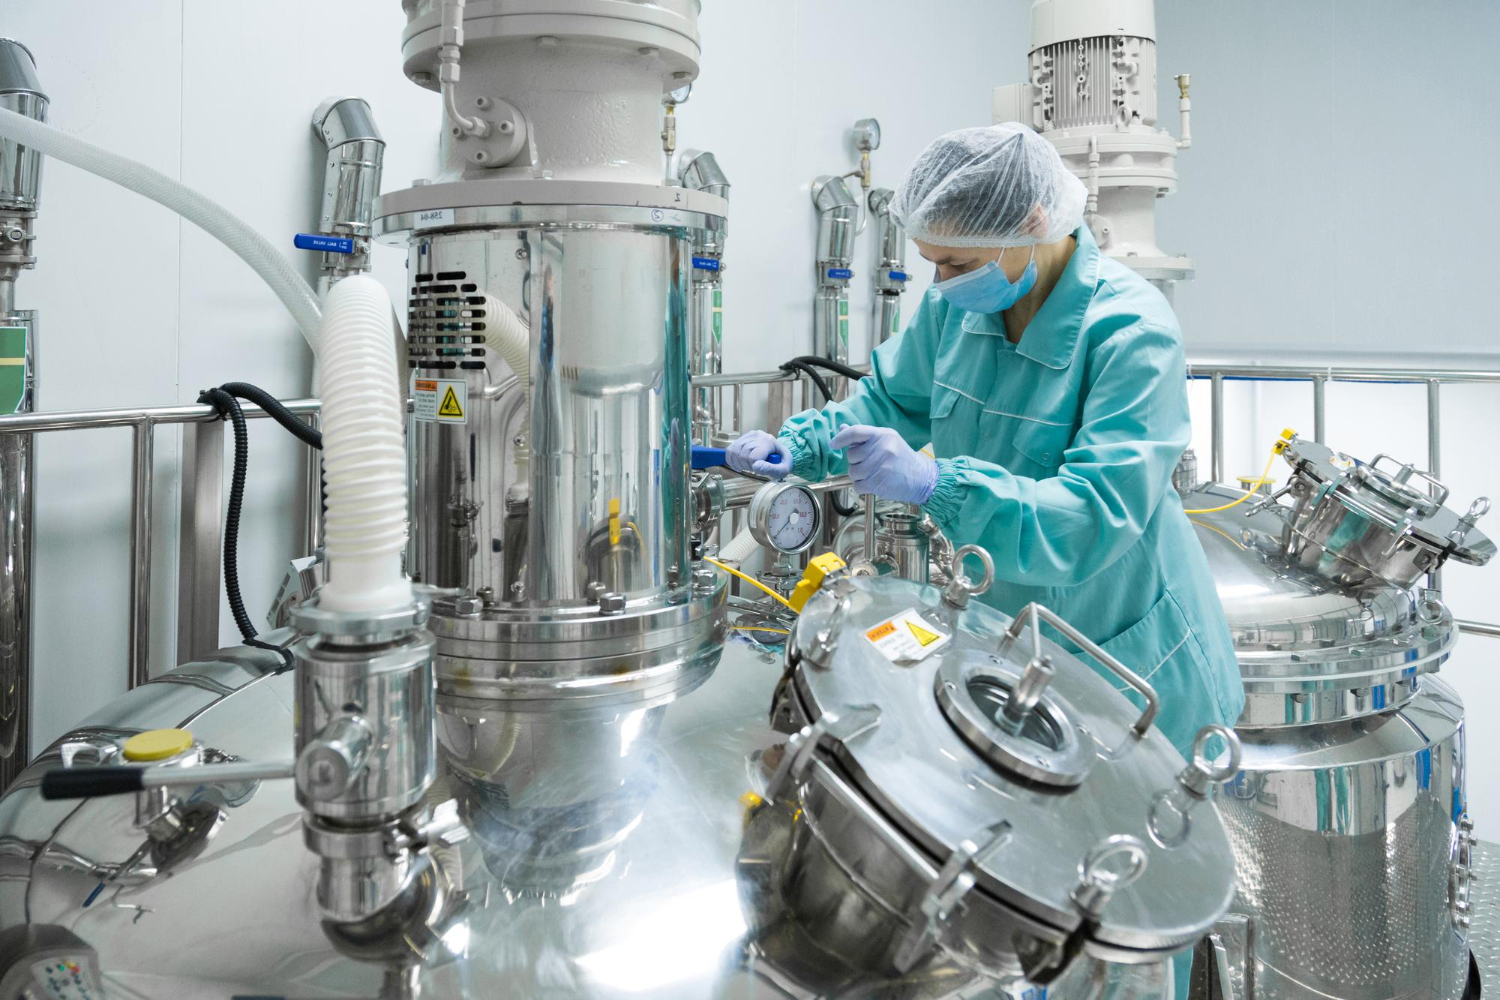
In sterile manufacturing, a batch rejection does not happen because of abstract systemic failure. It traces back to a process parameter that drifted without anyone noticing, an environmental condition nobody was watching, or an inspection decision made under conditions where human judgement is structurally unreliable. The write-off is only the visible part of the cost. Without that evidence, a model that flags drift is one more alarm that QA cannot act on.
What does a single sterile batch failure actually cost?
The usual figure for a lost batch is either its standard production cost or its projected market value. GMPKit argues that this single number is incomplete and often materially misleading, because it leaves out the unplanned work, diverted resources and lost capacity that pile up across operations, quality, supply chain and management. GMPKit sorts the costs into three categories that compound one another: direct recovery costs to replace or recover the batch, system disruption costs that degrade flow and efficiency, and structural costs that constrain capacity and future decisions.
A deviation investigation means time from subject matter experts, QA and management to find the root cause and document it under 21 CFR 211.192. In a sterile facility the investigation also has to decide whether any other processes or batches are affected, and the reason for including or excluding each batch has to be justified and recorded.
A BioProcess International survey of 145 biopharmaceutical organisations says even failure rates under 10% are costly, because batch raw material and resource costs often exceed $1–2 million. For utilities such as Water for Injection (WFI) pumps and air handling units, BioProcess Online notes that failures can cause costly batch losses, especially with expensive biologics, or unexpected production shutdowns.
Treat any published multiple with care. GMPKit states that most companies underestimate the true cost of a lost batch by 5–10× and that cost of poor quality quietly makes up 25–40% of operational cost in many pharmaceutical organisations. Use those figures mainly as a reason to cost your own last failure properly. For more on that accounting, see our companion piece on the real cost of pharmaceutical batch failure and how AI prevents it.
Which root causes of batch failure (deviation, human error, equipment, raw materials) are addressable with AI?
In the same BioProcess International survey, a facility experiences a batch failure on average once every 40.6 weeks (9.4 months). In facilities of 1,000 L and larger, contamination was the most frequent cause (2.3%), and the four leading causes (contamination, operator error, equipment failure and failure to meet specifications) made up 80% of all failures. Below 1,000 L, material failure was the most common cause (1.9%), and product cross-contamination accounted for 1.1%. Total failure rates were similar at the two scales (7.6% and 6.6%), but the survey says the mix of causes appears to vary significantly by scale. The survey covers biopharmaceutical organisations generally rather than sterile fill-finish alone, so read it as a guide to which causes dominate, not as a rate for your own site.
| Root cause | What AI can realistically contribute | Where AI does not help |
|---|---|---|
| Contamination | Continuous trending of particulate, viable, pressure and utility data to catch deterioration before an action limit is breached | Assuring sterility on its own: Annex 1 states that monitoring or testing alone does not give assurance of sterility |
| Equipment failure | Anomaly detection on vibration, flow and cycle data from critical utilities and sterilisers | Replacing equipment qualification, or the recorded impact assessment Annex 1 requires before unplanned maintenance on sterility-critical equipment |
| Operator error | Linking interventions and gowning events to excursions, and surfacing recurring patterns in deviation text | Fixing the underlying cause where it is training: one industry executive told BioProcess International that batch failures occur primarily because of training problems in aseptic technique |
| Failure to meet specifications | Spotting drift in critical process parameters between batches before release testing finds the failure | Replacing release testing: in FDA’s fill-volume example, release testing is what keeps model influence low |
| Material failure | Trending incoming-material data against downstream outcomes | Supplier qualification, which Annex 1 calls critical for sterile single-use systems |
The pattern in that table is our reading of the evidence. AI earns its place where the failure starts as a measurable drift, and it does much less where the cause is design, training or supplier control.
Which leading indicators predict a sterile batch failure before it happens?
The most useful leading indicators are the continuous signals Annex 1 already requires, read for trend rather than only for limit breaches.
- Grade A particulates. The Grade A zone should be monitored continuously for particles ≥0.5 and ≥5 µm at a flow rate of at least 28 litres per minute, so that interventions, transient events and any system deterioration are captured.
- Viable air in critical zones. Continuous viable monitoring in Grade A should run for the full duration of critical processing, including aseptic set-up.
- Pressure differentials. Differentials identified as critical should be continuously monitored and recorded, with a warning system for any failure.
- WFI quality. WFI systems should include continuous monitoring such as total organic carbon (TOC) and conductivity, which may indicate overall system performance better than discrete sampling.
- Sterilisation cycles. Sites need mechanisms to detect a cycle that does not conform to validated parameters.
- Inspection defects. Defect types and numbers should be trended, with reject levels trended on statistical principles.
- Utility equipment health. Vibration and performance data from pumps and air handlers, as in the case below.
One published utility case shows a leading indicator in practice. BioProcess Online describes how JHS fitted 100 wireless vibration sensors with AI capabilities to WFI pumps and air handling units, built operating baselines and alerted maintenance teams to deviations from normal patterns. After a scheduled shutdown, one WFI pump showed excessive velocity on restart; the system flagged it, engineers found a misaligned coupling, and it was corrected before the pump went back into production. The article credits the result to AI working alongside expert decision-making, not to the model alone.
FDA’s process validation guidance gives the reason prediction matters: a process is likely to meet sources of variation that development never exposed it to, and FDA recommends quantitative, statistical methods to detect, characterise and trace them. Continued process verification already requires data to be statistically trended and reviewed by trained personnel. What a model adds is earlier detection and correlation across streams. It does not change who is accountable for reviewing the trend. For contamination control specifically, our piece on AI-driven aseptic operations looks at the aseptic core in more depth.
How does an AI-driven batch-failure prevention approach handle the distinction between corrective action (CAPA) and preventive action: and where do AI leading indicators shift effort from corrective to preventive?
Corrective action responds to a non-conformity that has already happened; preventive action removes the cause of one that has not happened yet. ICH Q10 makes both part of a single CAPA system, fed by deviations, product rejections, audits, inspections and trends from process performance and product quality monitoring. That last input, trends, is where the effort can move.
Annex 1 sets different responses for its two limits. When an action limit is exceeded, procedures should require a root cause investigation, an assessment of the impact on product, and corrective and preventive actions. When an alert level is exceeded, procedures should require assessment and follow-up, including consideration of an investigation or corrective actions to stop further deterioration. Annex 1 also names trend patterns worth acting on: rising numbers of alert or action breaches, consecutive alert breaches, regular but isolated action breaches with a common cause (for example excursions that always follow planned preventive maintenance), and shifts in microbial flora.
Those patterns are hard to see by hand and easy for a model to surface. An excursion that follows every planned maintenance event looks like a series of unrelated single events in a deviation log, and only becomes a preventive action once someone connects them. Annex 1 frames the same question as deciding whether a breach is an isolated event or a sign of loss of control or system deterioration. AI trending moves effort towards prevention by answering that question earlier, at alert level, before the action-limit investigation becomes the corrective route.
ICH Q10 says proposed changes should be evaluated with quality risk management, with effort proportionate to risk, and Annex 1 says requalification should follow remedial action or changes to equipment, facility or process.
How does AI-driven deviation investigation reduce time-to-CAPA and prevent recurrence?
AI can shorten the part of an investigation spent searching history. ICH Q10 asks for a structured investigation aimed at the root cause, with effort, formality and documentation proportionate to risk. Much of the evidence for that investigation sits in earlier deviation reports, a mainly unstructured source of data.
Two studies show where the leverage is. A 2022 MIT thesis done with Amgen found that past investigation results were stored long term but only partly structured, which made it hard to use them to speed up investigations or study long-term quality trends. Using natural language processing on deviation and causal-factor text, the author recommended a tool that shows potential causal factors to investigators straight away, built on clustering and text extraction. A Merck study in the International Journal of Pharmaceutics tested generative large language models and text embedding models on example deviation and quality tasks, found significant potential, and raised open questions that need more research. The same authors warn that without specific problem statements, work drifts into a vaguely defined “Gen-AI” bucket and progress slows.
Neither study reports a measured reduction in time-to-CAPA, so we quote none. The mechanism is plausible all the same: if an investigator starts with similar past deviations, their confirmed root causes and the CAPAs that closed them, the hours go into checking a hypothesis instead of building a search. Recurrence prevention comes from the same retrieval used across investigations, because a cluster of similar deviations with different stated root causes suggests the real cause was never found. The model proposes; the investigator decides and signs.
How do AI models for batch-failure prediction integrate with electronic batch records and existing quality systems?
A batch-failure model used in a critical GMP application runs inside a computerised system, so it inherits those controls. The revised EU Annex 11 strengthens requirements on data integrity, audit trails, electronic signatures and system security, and applies quality risk management across the system lifecycle. The revised Chapter 4 requires documents in any format to stay complete and readable throughout their lifecycle.
The batch record is where the model’s output meets release. Annex 1 requires environmental monitoring results to be considered when batch documentation is reviewed for certification, and sterilisation records to be reviewed and approved as part of batch certification. A model flag that bears on a batch therefore has to land in the same reviewable, audit-trailed record, not in a separate dashboard. Draft Annex 22 adds that, during testing of critical models, systems should record the features that contributed to a decision such as a rejection, using feature attribution (for example SHAP or LIME) or heat maps where applicable.
Two more integration points are easy to underestimate. Draft Annex 22 puts the model, the system it runs in and the process it supports under change control before deployment, including changes to physical inputs to the model. FDA’s draft guidance expects lifecycle maintenance plans (metrics, monitoring frequency, retest triggers) to be available as part of the site’s pharmaceutical quality system. In practice the integration is as much about the QMS (change records, CAPA links, periodic review) as about the MES or EBR interface.
What evidence will QA and inspectors need before an AI model influences a batch?
FDA’s draft guidance starts from the context of use: the specific role and scope of the model, what is modelled, how outputs are used, and whether other evidence is used alongside it. Model risk then combines model influence (how much the model contributes relative to other evidence) with decision consequence (how serious an incorrect decision would be). Credibility activities should be proportionate to that risk.
The guidance’s own sterile example is useful. For a model supporting fill-volume decisions on vials, incorrect volume could lead to medication errors, so the decision consequence is high. Because release testing still measures fill volume on a sample from every batch, model influence is low, and the model risk for that use is medium. Keeping an independent check in place is a design choice that lowers the evidence burden, and it is often the right first deployment. For how vision and inspection fit on the line, see our piece on fill-finish solutions for pharma manufacturing.
Evidence checklist for an AI model in a sterile batch decision
- Context of use written down: the question, the model’s role and the other evidence it is used with.
- Model risk assessed: influence and decision consequence, with any mitigations that lower influence.
- Scope against Annex 22: whether the model is a critical application with direct impact on patient safety, product quality or data integrity.
- Acceptance criteria: at least as high as the performance of the process the model replaces, which means that process’s performance has to be known.
- Fit-for-use data: development data relevant and reliable (accurate, complete, traceable).
- Independent test data: never shown to the algorithm during training, with any deviation from the test plan documented and justified.
- Metrics with uncertainty: performance estimates with confidence intervals and a stated method for prediction uncertainty.
- Explainability record: features contributing to each decision captured during testing.
- Change control and retest rules: for the model, its system and the process.
- Operational monitoring: performance metrics, plus checks that inputs remain within the model’s sample space and intended use; FDA describes the gap between development and deployed data as data drift.
If credibility falls short, FDA lists ways forward: add other evidence to reduce influence, strengthen the assessment or the data, add controls, change the modelling approach, or revise the context of use. FDA strongly encourages early engagement on model risk and on the credibility assessment plan. For product-specific models, ICH Q12 tools such as established conditions and change management plans let sponsors agree in advance which model changes need no prior submission.
We treat this evidence as an engineering output in its own right: artefacts a QA lead or an inspector can read, defend and sign against, built alongside the model rather than written afterwards. Our wider view of AI for pharma compliance covers the quality-system side.
Can federated learning build a multi-site model without sharing batch records?
In principle, yes. In federated learning each site trains on its own data, sends only model weights to a central server for aggregation, and receives the updated global model, so sites never see one another’s datasets. A tutorial on federated learning in chemical engineering compared it with centralised training on three datasets and found it often maintained or improved classification performance, especially on complex, heterogeneous data, and described condition monitoring and fault diagnosis across distributed plants as a potential use.
Every aggregation round produces a changed model, and draft Annex 22 requires model changes to be evaluated for retest; a federation that retrains frequently creates a change-control load each site has to absorb. Each site still needs its own context of use, independent local test data and input-space monitoring, because a global model can perform well on average and poorly on one site’s isolator or filling line. Weights are less sensitive than batch records, but parties should still agree contractually what a shared model may reveal. For condition monitoring of shared equipment types across sites, federation is worth piloting; for a model that directly influences release, we would start with one site.
Who can build an AI monitoring model for a sterile line that QA can defend?
TechnoLynx builds drift and regression monitoring harnesses and approval evidence packs for AI models. On build versus partner: a site with data engineers who know its historians and QMS can own the model, and a specialist helps most where the credibility evidence and the production pipeline have to be engineered together. When choosing a partner, ask to see a credibility report and a monitoring plan from earlier work, not only model accuracy. For our life sciences work, see AI engineering for life sciences and healthcare.
The engagement has limits. We build the evidence artefacts an audit needs as engineering, not as policy advice or certification. A team that needs contamination control strategy authoring or validation documentation for non-AI systems is better served by a GMP validation consultancy. Built-in analytics from environmental monitoring or MES vendors can be the simpler route where they already cover the signal you care about.
Start where a breach already triggers an investigation
The defensible place to begin is a monitoring stream where action-limit breaches already create deviations and CAPAs, because there the model’s value shows up directly as earlier, alert-level prevention, and its acceptance criteria can be set against a process whose performance you already know. Annex 1 itself treats monitoring as the final element after facility design and procedures, and says monitoring alone does not assure sterility. The open question each site has to settle is how much influence it is willing to give the model on a batch decision, because that choice, more than the algorithm, decides how much evidence it will have to build. For where this sits among other production uses, see our overview of where AI adds value in drug manufacturing.
FAQ
What is sterile manufacturing in pharma?
Sterile manufacturing is the production of medicinal products under special requirements that minimise the risk of microbial, particulate and pyrogen contamination. EU GMP Annex 1 requires a contamination control strategy across the facility that defines critical control points and assesses how effective the controls are.
What is aseptic drug manufacturing?
Aseptic manufacturing is used when a product cannot be sterilised in its final container: the solution is sterilised by filtration through a validated sterilising-grade filter (nominal 0.22 µm or less) and filled aseptically into previously sterilised containers. Annex 1 prefers terminal sterilisation where possible, because it gives greater assurance of sterility than sterile filtration or aseptic processing.